Couchbase Query Analysis Hub

Concise guidance to process data, interpret stats, and optimize queries.

Why is my query slow? Start with Reading the Performance Data, then apply Crawl → Walk → Run. New to terms? See the glossary.

How to Process and Generate Charts/Stats

1) Extract Data

Run this in Query Workbench, Capella Query tab, or cbq, then export as JSON.

SELECT *, meta().plan FROM system:completed_requests ORDER BY requestId LIMIT 2000;

Tip: For larger datasets, prefer targeted filters (see below) before exporting.

Sample completed_requests JSON

2) Paste or Upload JSON

Open Analyzer — in the upper-left input, paste or upload your JSON and it will auto-parse, or click Parse JSON.

Parse JSON button in the analyzer

Private & secure: Runs and processes your data entirely in your browser and its memory. No server uploads.

3) Parse JSON & Filters Overview

After parsing, use filters to focus analysis:

  • Date/Time Range — From/To with quick presets (Original | 1 Week | 1 Day | 1 Hour)
  • SQL++ Statement Contains — text filter for keywords/patterns

    PRO – a great way to focus only on one query pattern and reduce the noise from other queries

  • Elapsed Time Filter — comparisons and ranges (e.g., >=500ms, 0.5s-2s)
    Filter Examples

    Filter by the elapsedTime of each query using comparisons and ranges. Supported: <, <=, =, >, >=, ranges like 100-500ms or 0.5s-2s, unit-inferred ranges like 3-15s, shorthand 500ms+ (means >= 500ms), and bare numbers (e.g., 150 means >= 150ms).

    • Comparators: >500ms, >=1s, <2s, =150ms
    • Ranges (inclusive): 100-500ms, 0.5s-2s, 3-15s (unit applied to both sides)
    • Shorthand: 500ms+ (same as >=500ms)
    • Bare number: 150 is interpreted as >=150ms
  • Exclude System Queries — hides system:*, INFER/ADVISE, CREATE/ALTER INDEX, etc.
4) Analyzer Tabs
Dashboard screenshot Dashboard screenshot (full view)
Dashboard
High-level charts and distributions
Insights screenshot Insights screenshot (full view)
Insights
Automated checks and quick wins
Timeline screenshot Timeline screenshot (full view)
Timeline
Time-series performance with zoom
Query Groups screenshot Query Groups screenshot (full view)
Query Groups
Normalized patterns and aggregates
Every Query screenshot Every Query screenshot (full view)
Every Query
Sortable table of executions
Index/Query Flow screenshot Index/Query Flow (full view)
Index/Query Flow
Relationship diagram
Indexes screenshot Indexes screenshot (full view)
Indexes
Inventory and performance of indexes
5) Add Indexes JSON (Optional but Recommended)

Run this separate query for system:indexes and paste/upload to the upper-right input to enrich Indexes and Flow views.

SELECT 
    s.name,
    s.id,
    s.metadata,
    s.state,
    s.num_replica,
    s.`using` AS indexType,
    CONCAT("CREATE INDEX ", s.name, " ON ", k, ks, p, w, ";") AS indexString
FROM system:indexes AS s
LET bid = CONCAT("", s.bucket_id, ""),
    sid = CONCAT("", s.scope_id, ""),
    kid = CONCAT("", s.keyspace_id, ""),
    k = NVL2(bid, CONCAT2(".", bid, sid, kid), kid),
    ks = CASE WHEN s.is_primary THEN "" ELSE "(" || CONCAT2(",", s.index_key) || ")" END,
    w = CASE WHEN s.condition IS NOT NULL THEN " WHERE " || REPLACE(s.condition, '"', "'") ELSE "" END,
    p = CASE WHEN s.`partition` IS NOT NULL THEN " PARTITION BY " || s.`partition` ELSE "" END;

Sample system:indexes JSON

What the Stats and Tables Mean

Reading the Performance Data #

The Every Query tab lets you see stats per individual query to spot bottlenecks and get timings of operations in detail.

Query statistics table showing performance metrics
  • elapsedTime — Total wall-clock from request acknowledgment to last byte sent.
  • serviceTime — Active execution time while waiting on services (Index, Data, FTS).
  • executionTime — Internal query processing time (engine logic).
  • cpuTime — Cumulative CPU consumed across threads (can exceed wall time).
  • kernTime — Time spent waiting for CPU scheduling by the OS.
  • resultCount — Number of documents returned to the client.
  • resultSize — Total bytes sent; affects network transfer time.
  • phaseCounts.fetch — Number of full documents retrieved from data service
  • phaseCounts.indexScan — Number of matching records from the index(es) service

Watch-outs: large resultSize stretches elapsedTime; high usedMemory suggests heavy sorts/aggregations or big payloads.

System & Node Impact #

Performance is influenced by node CPU, memory, and service placement. Large results also increase network time.

Query node architecture impact
  • kernTime — Time spent waiting for CPU scheduling by the OS.
  • cpuTime — Cumulative CPU consumed across threads (can exceed wall time).
  • memoryUsed — Cumulative Memory used to execute a query

The image above shows the Query service handling multiple concurrent requests on a single node. The OS kernel schedules query threads onto a limited number of CPU cores, so parts of a query must “wait” when resources are contended. This scheduling delay appears as kernTime at the operator level and stretches execution/elapsed time without doing useful work.

  • Limited CPU cores → thread contention and context switching under load
  • Memory pressure → GC/paging can increase pauses and reduce throughput
  • Service co-location (Query with Index/KV) → competition for CPU and memory on the same node
  • Large resultSize → longer post-execution network transfer time

Reduce contention by scaling query nodes, tuning concurrency, creating covering indexes to reduce fetches, and minimizing payload size.

ServiceTime in Context #

The Query service relies on other services in the cluster to operate (Data, Index, FTS, and Auth Service). This statistic is a sum of time spent waiting on all these services for this particular query.

Pro Insights: How to Read the Stats PRO #
  • High kernTime → CPU contention; check system load and concurrency.
  • High phaseCounts.fetch → add covering indexes; reduce fetches.
  • Large resultSize vs resultCount → optimize projection; narrow scans.
  • elapsedTimeserviceTime → queuing/network; scale query nodes/services.
  • cpuTime high ~ serviceTime → CPU-bound; simplify expressions or add cores.

Quick patterns: elapsedTime ≫ serviceTime → queuing or network; cpuTime ~ serviceTime → CPU-bound; kernTime high → CPU contention.

See also: Performance Data and ServiceTime Context.

Crawl → Walk → Run

CRAWL · Basic Index Strategy # CRAWL: full index scan pattern
  • High phaseCounts.fetch; phaseTimes.fetch dominates.
  • Larger resultSize; moderate serviceTime.
  • Often primary or non-covering indexes; broad scans.

Success: reduce phaseCounts.fetch and phaseTimes.fetch by 30–50%.

See the glossary: serviceTime, elapsedTime

WALK · Targeted Composite Indexes # WALK: reduced index scan pattern
  • Reduced phaseCounts.fetch via better pre-filtering in indexes.
  • More selective phaseCounts.indexScan; improved serviceTime.
  • Projection refined; data scanned narrows.

Success: sustained drops in fetch counts/time; stable or lower resultSize; fewer I/O waits.

See the glossary: executionTime, serviceTime

RUN · Covering Indexes # RUN: covering index pattern
  • phaseCounts.fetch = 0 — no document fetches.
  • Minimal resultSize (project only needed fields).
  • Minimal serviceTime; low kernTime.

Success: 70–90% reduction in serviceTime; faster and more predictable queries.

See the glossary: kernTime, serviceTime

In Summary: Crawl / Walk / Run Metrics
  • CRAWL: High phaseCounts.fetch, large resultSize, higher serviceTime
  • WALK: Reduced fetch, more selective indexScan, improved serviceTime
  • RUN: fetch=0 (covering index), minimal resultSize, optimal serviceTime

Performance

What is a Couchbase Index? #

A Couchbase index is a data structure that creates shortcuts to your documents, allowing queries to find data efficiently without scanning entire buckets. When you create indexes with CREATE INDEX statements, they are stored and managed by the Index Service.

Couchbase CREATE INDEX commands showing how indexes are organized on Index Node with key-value pairs

How Index Creation Works

As shown in the diagram above, when you execute CREATE INDEX statements:

  • custId_status_v1: Creates an index on (status, custId) fields, organizing data like "done,1234", "done,5678", "draft,1234"
  • email_v1: Creates an index on (email) field, organizing data like "@yahoo.com", "@gmail.com", "@aol.com"
  • Index Node Storage: All indexes are stored on dedicated Index Service nodes
  • Key-Value Organization: Each index maintains sorted key-value pairs for fast lookups
  • Document References: Index values point to document keys (like 1234, 5678) for quick document retrieval
💾 Index Memory Usage: The Performance Game-Changer #

The percentage of your index stored in memory directly impacts query performance. Higher memory residency means faster query execution, while lower memory residency can lead to disk I/O and slower responses.

High Memory Residency (90%+)

Couchbase index with high percentage of data in memory showing optimal performance

Optimal Performance: Most index data is in RAM, resulting in fast lookups and minimal disk I/O. Ideal for frequently accessed indexes.

⚠️ Low Memory Residency (20-40%)

Couchbase index with small percentage of data in memory showing performance impact

Performance Impact: Frequent disk reads required, leading to higher latency and reduced throughput. Consider increasing memory allocation.

Index Memory Optimization Strategies

Memory Optimization Tips

  • Monitor Memory Residency: Use our tool to track what percentage of your indexes are in memory
  • Increase Index RAM: Allocate more memory to the Index Service for frequently used indexes
  • Index Selectivity: Create more selective indexes to reduce overall memory footprint
  • Partition Indexes: Use partitioned indexes to distribute memory load across nodes
  • Archive Old Data: Remove or separate historical data that doesn't need high-performance access

Index Performance Impact

Memory residency directly affects:

  • Query Latency: In-memory indexes respond 10-100x faster than disk-based lookups
  • Throughput: Higher memory residency allows more concurrent queries without performance degradation
  • CPU Usage: Less CPU spent waiting for disk I/O when indexes are in memory
  • Consistency: Predictable performance when indexes don't compete for disk resources
⚠️ Drawbacks of Primary Indexes WARNING #

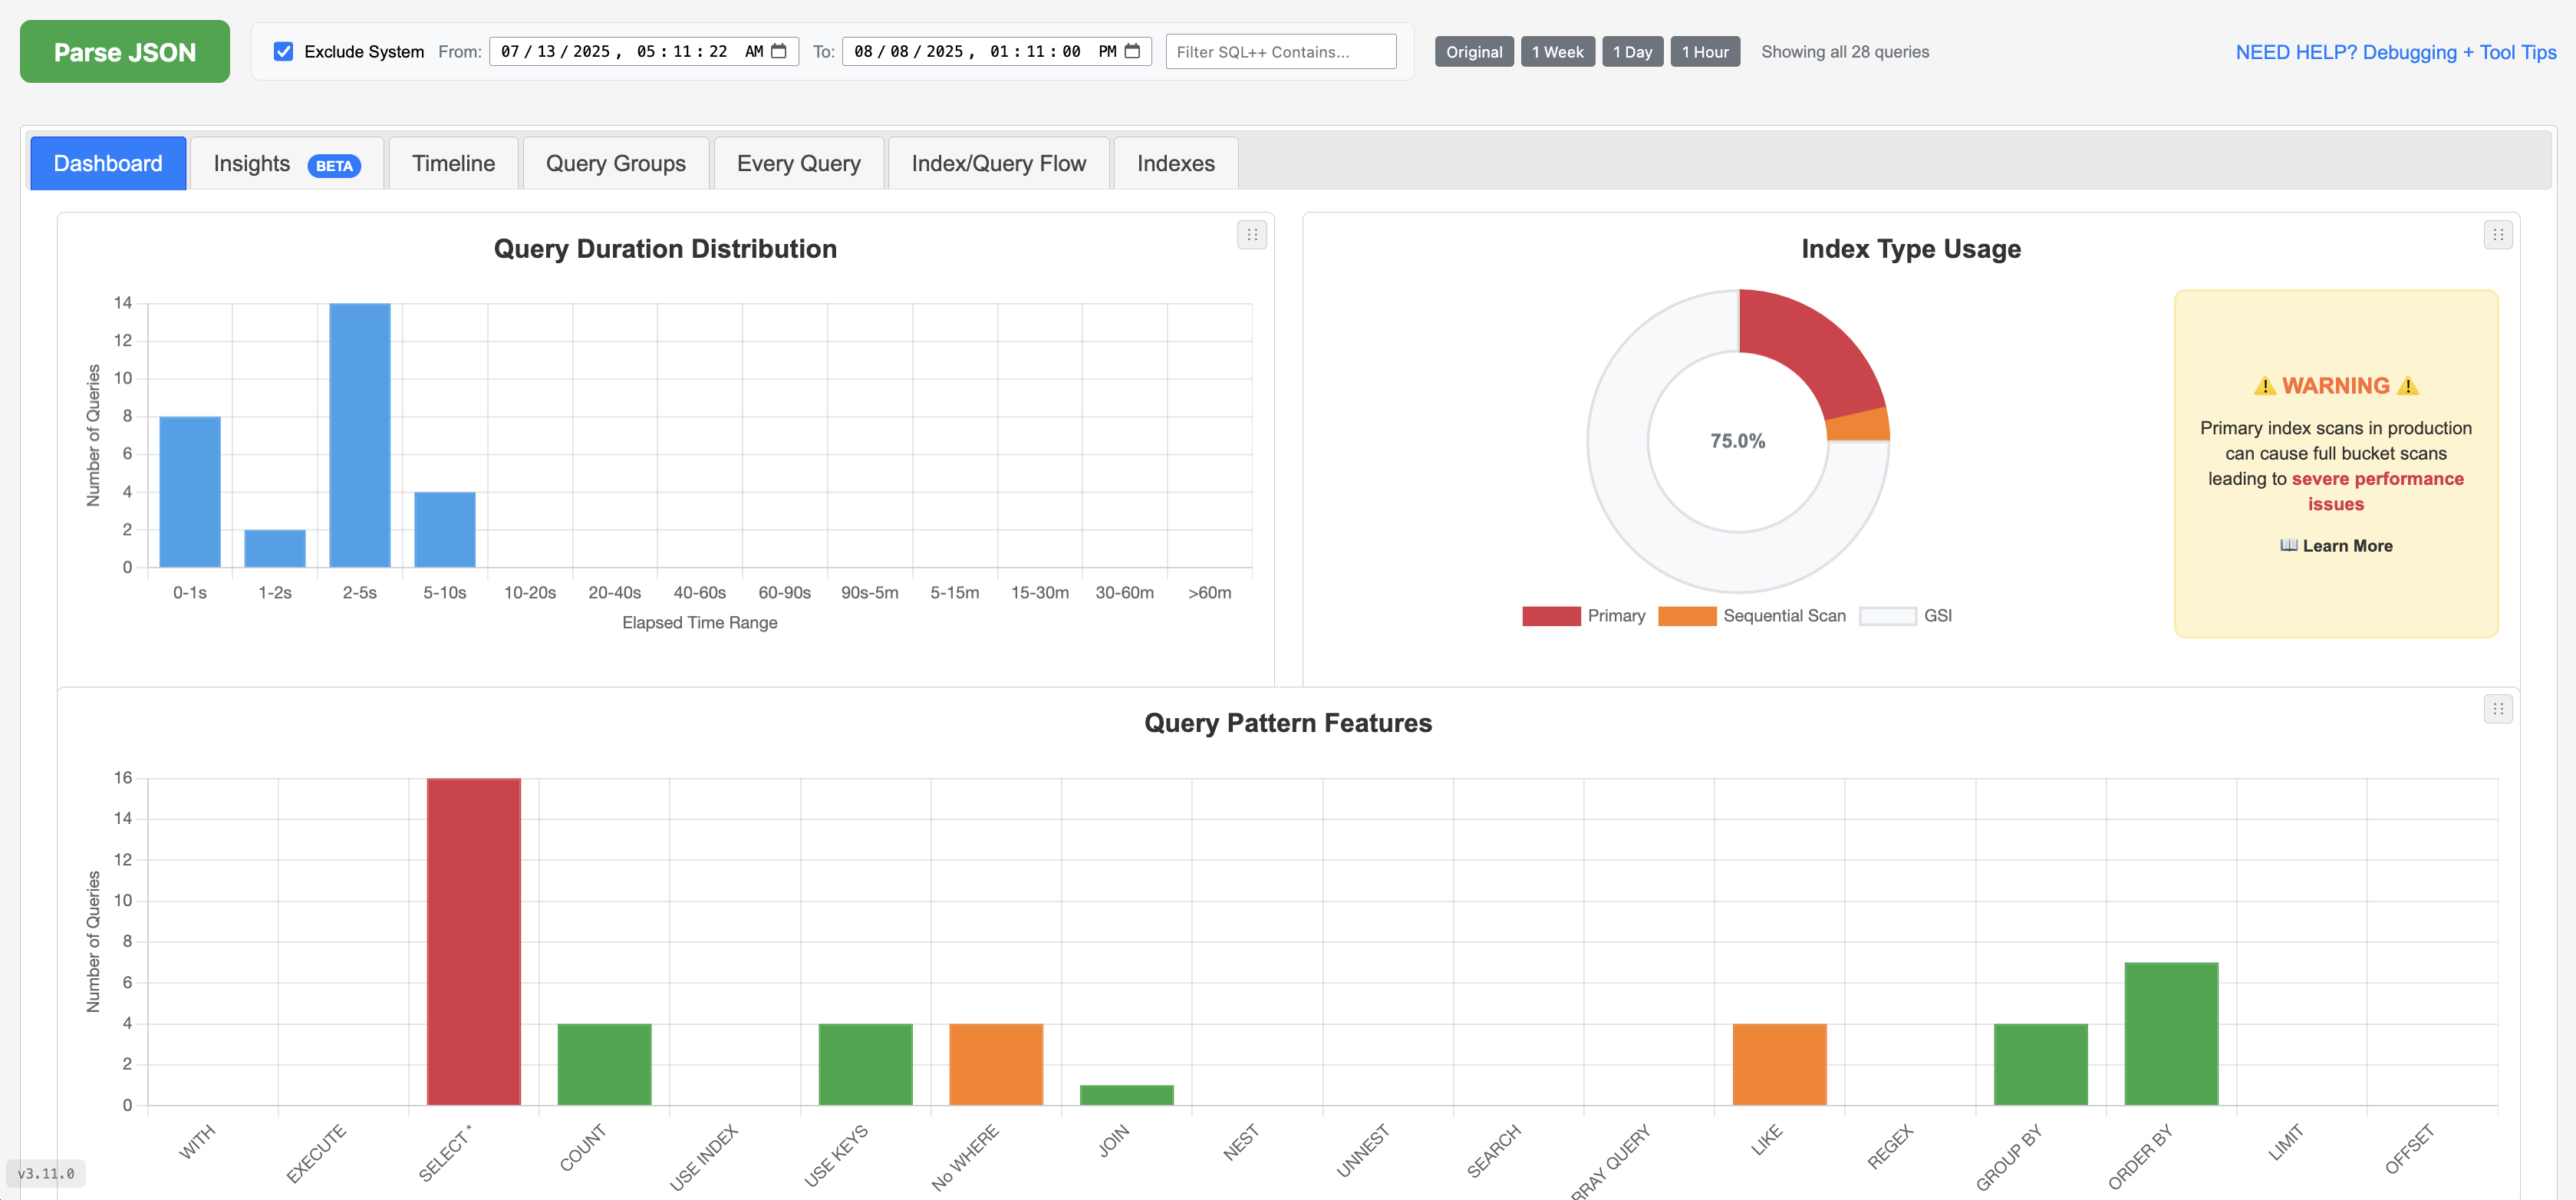
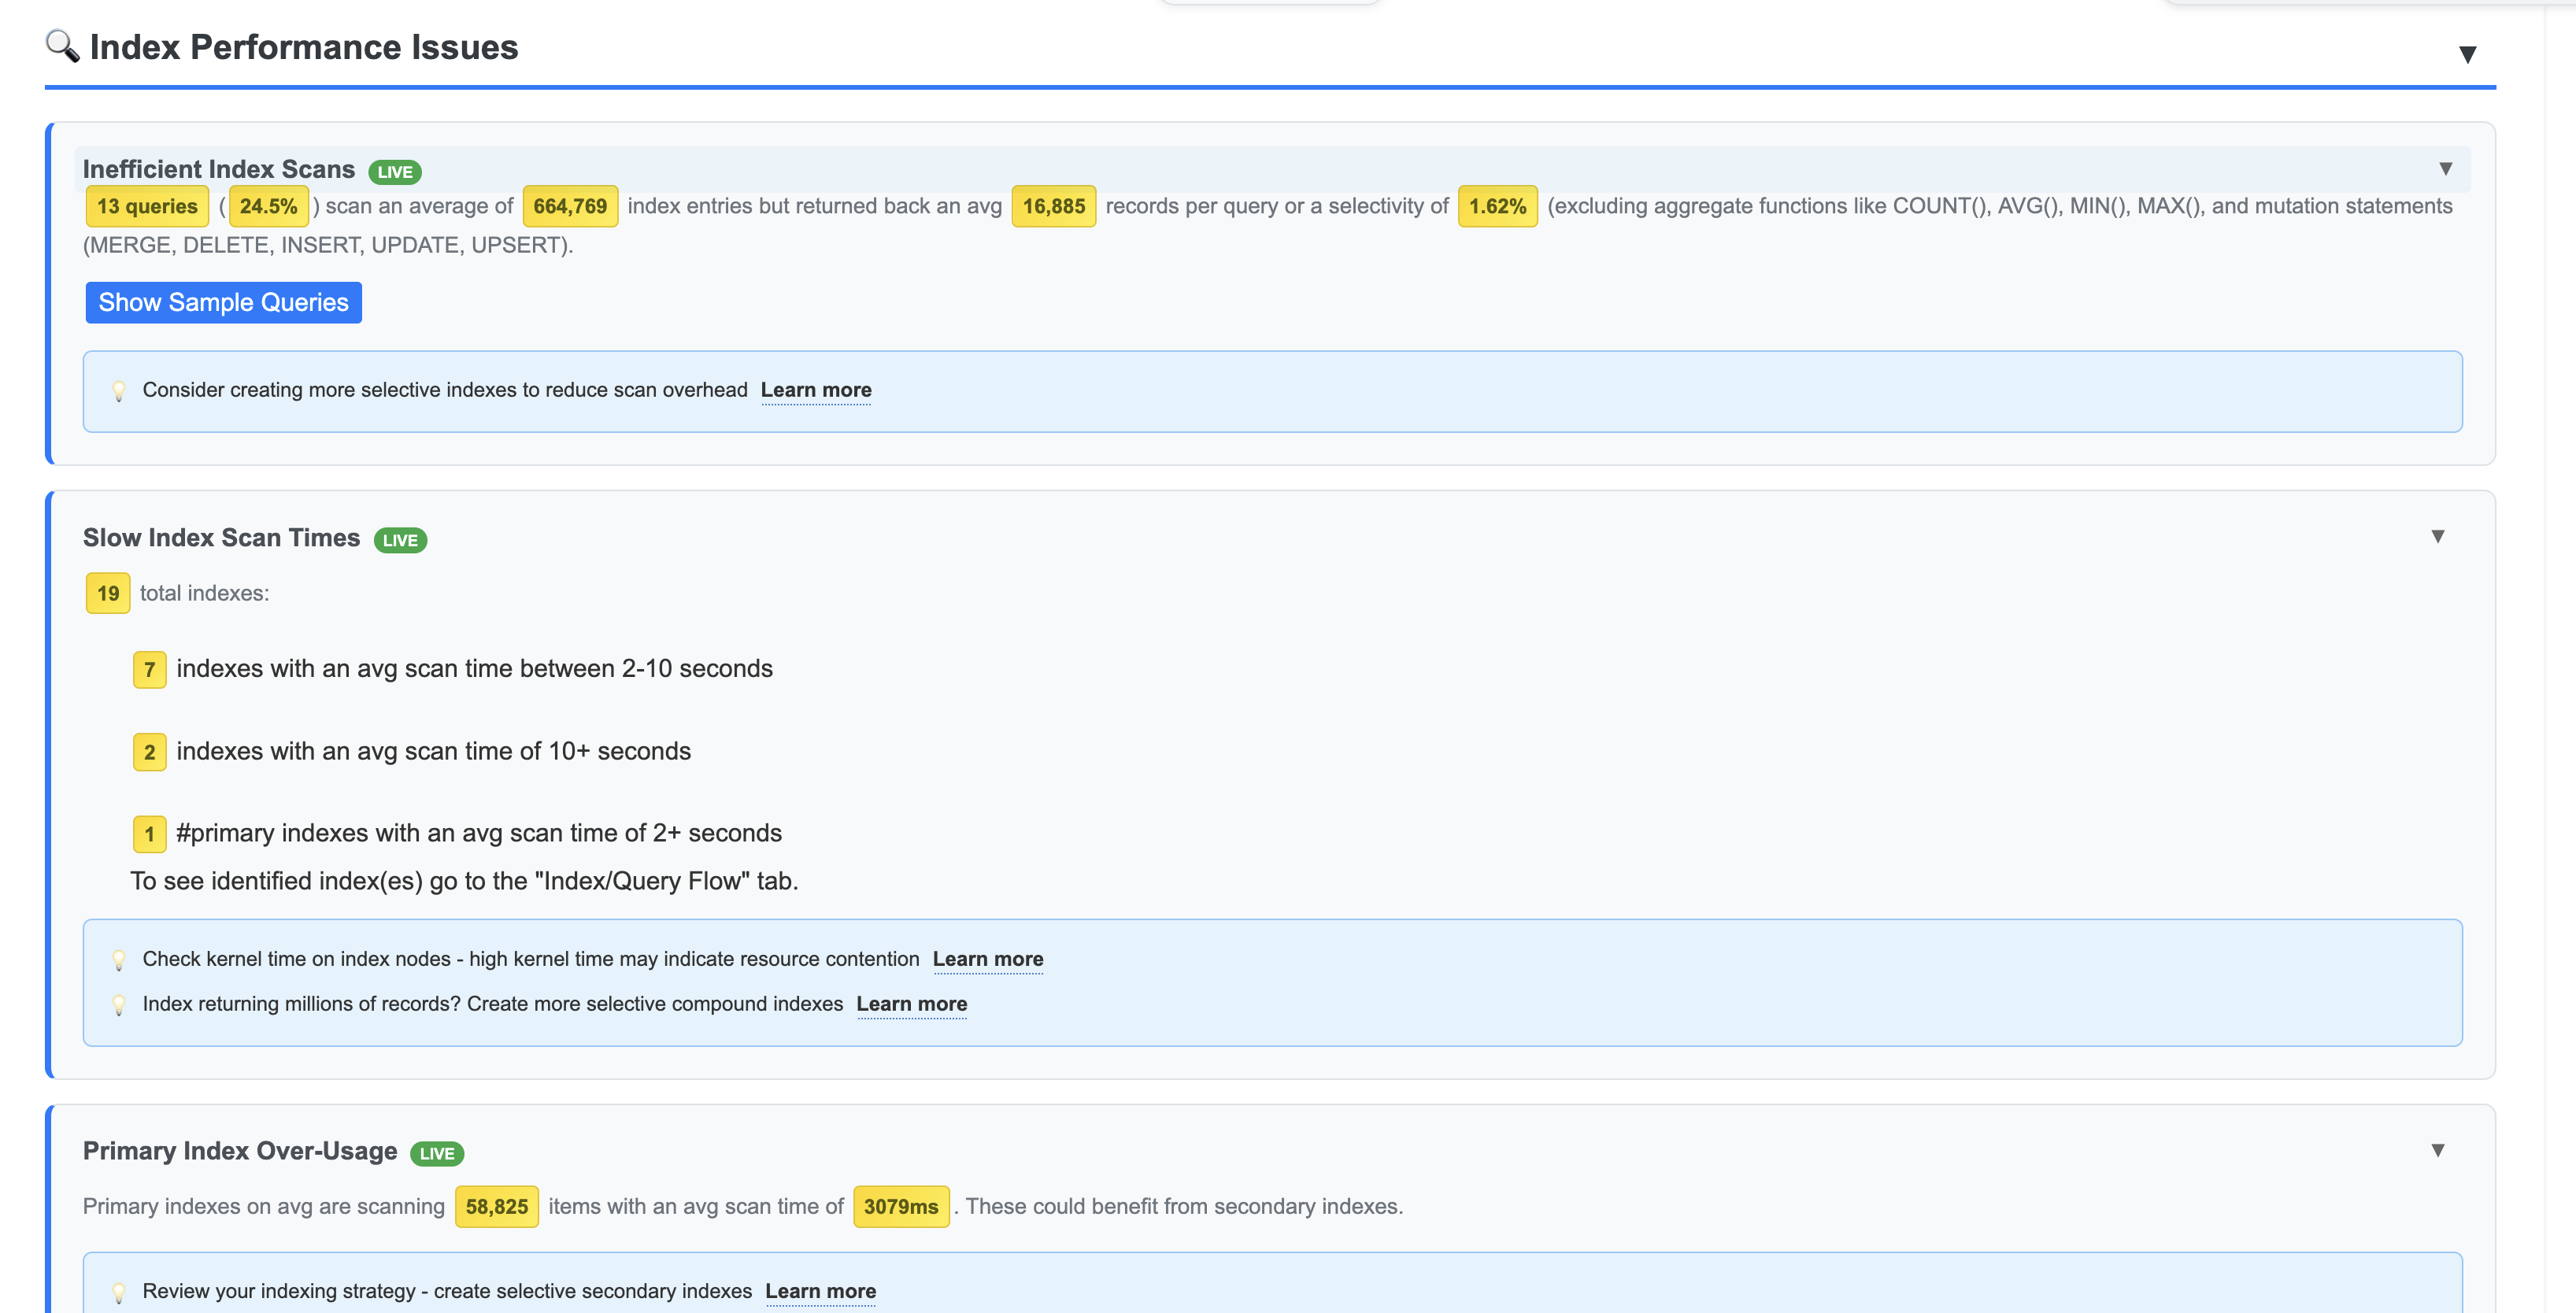
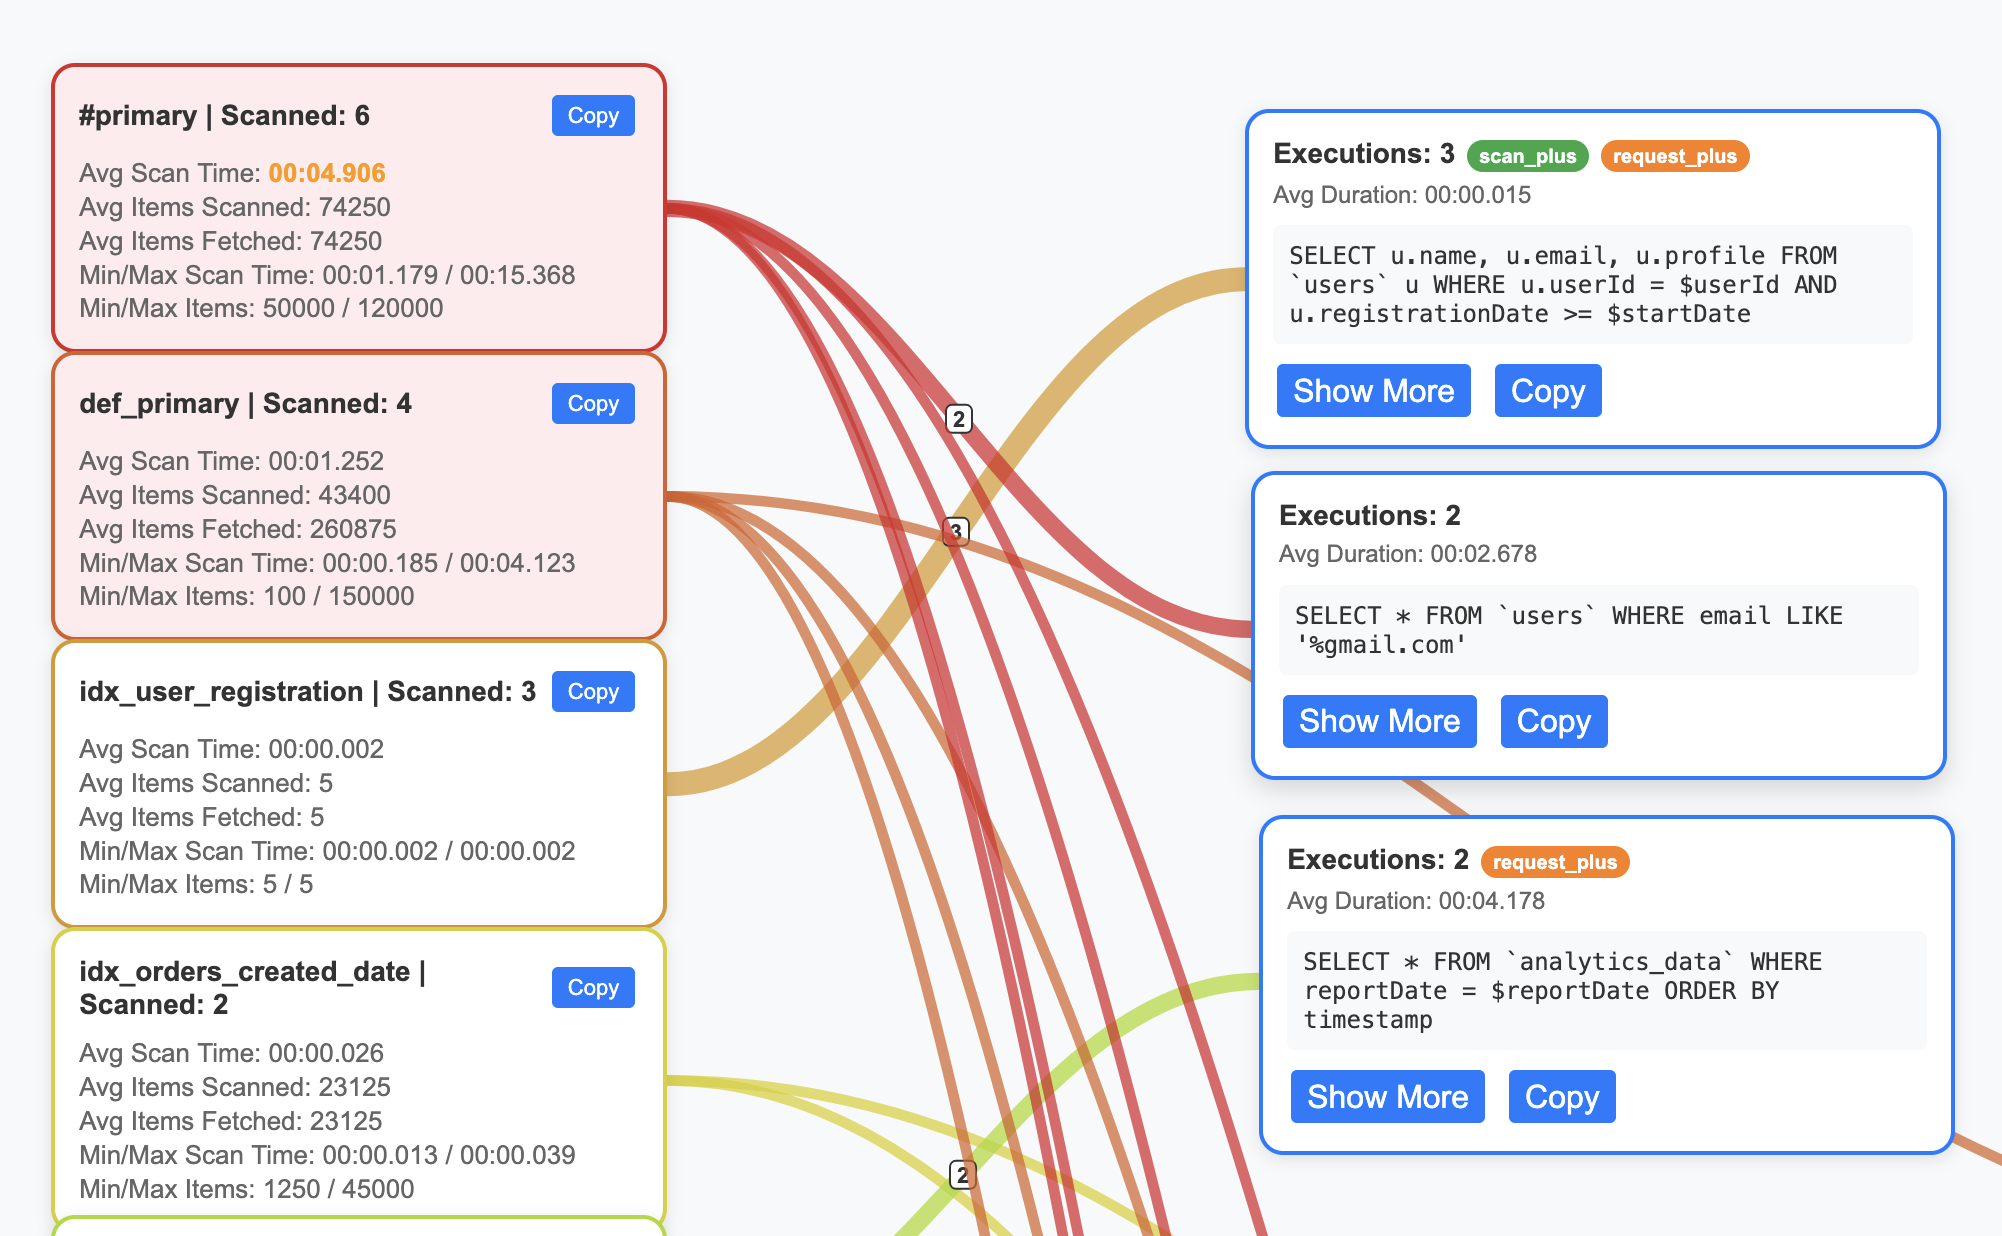
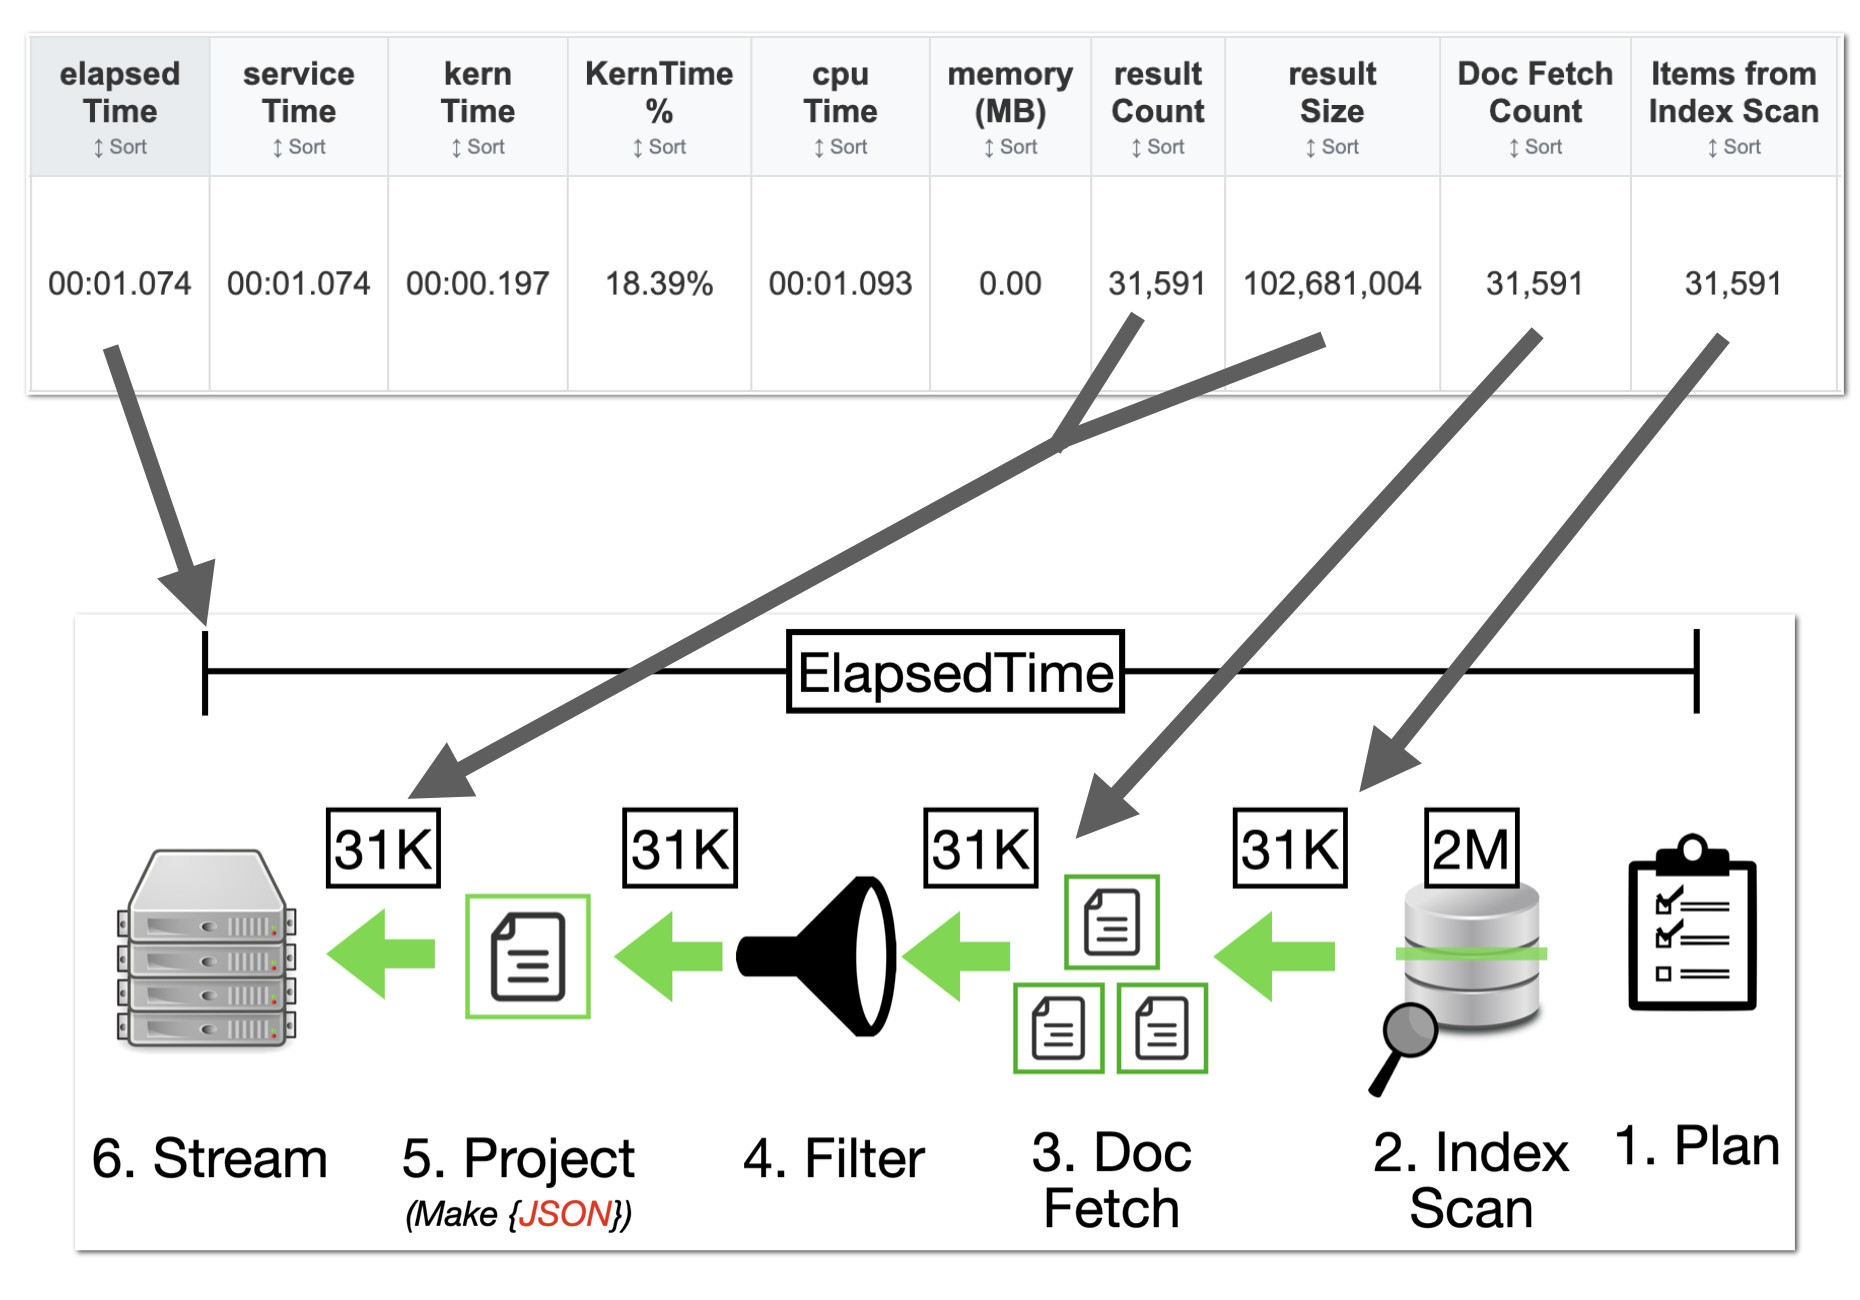
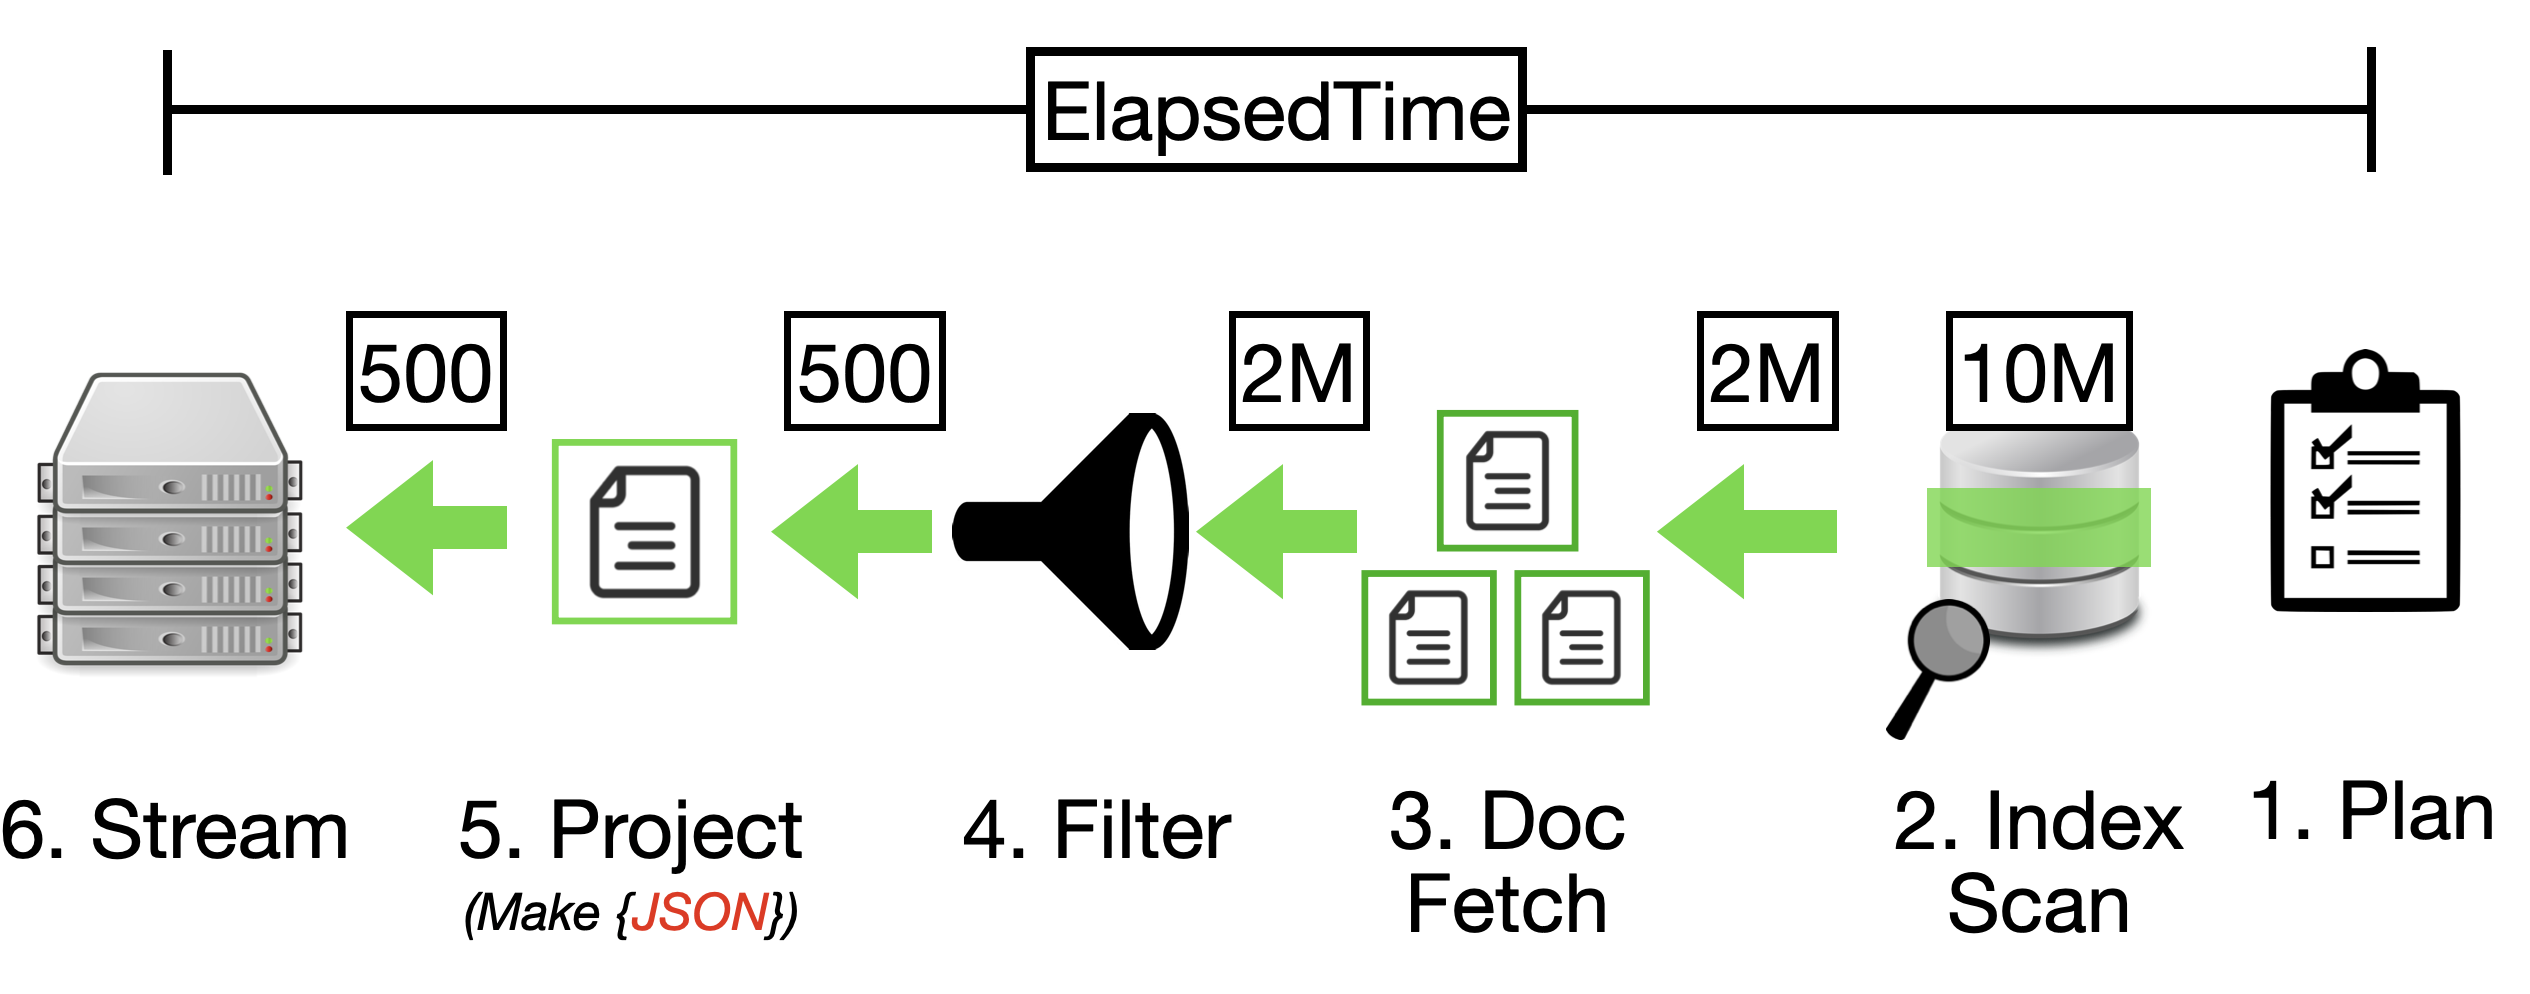
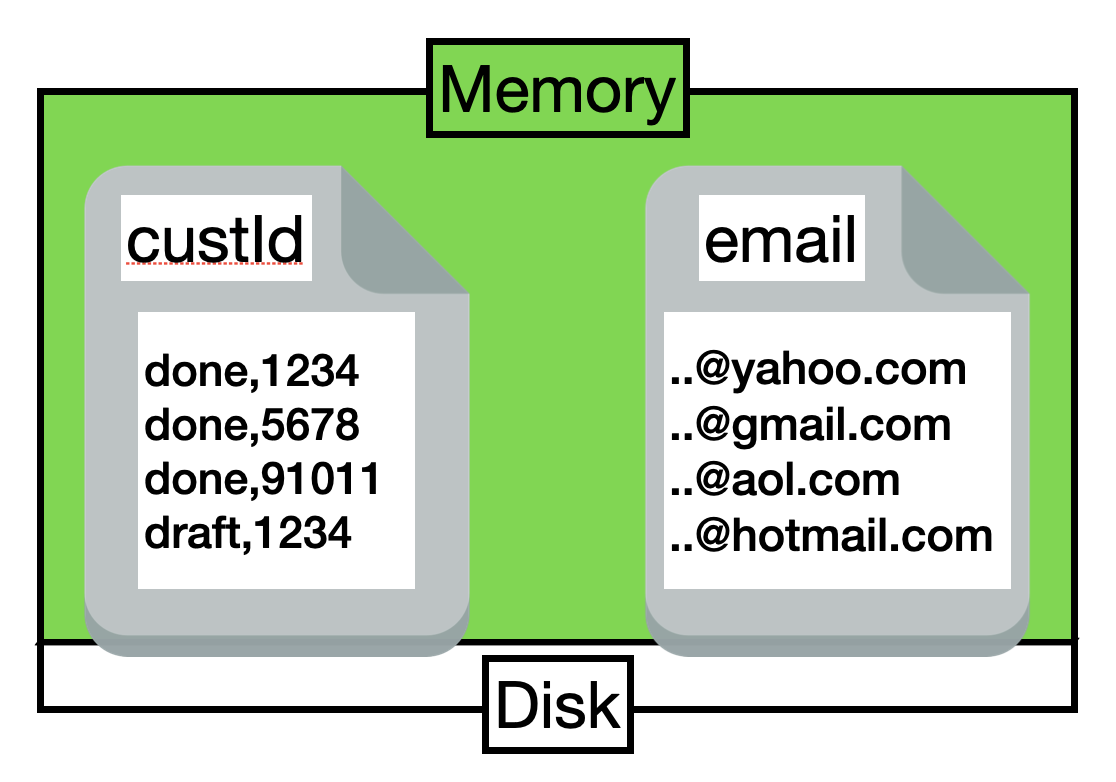
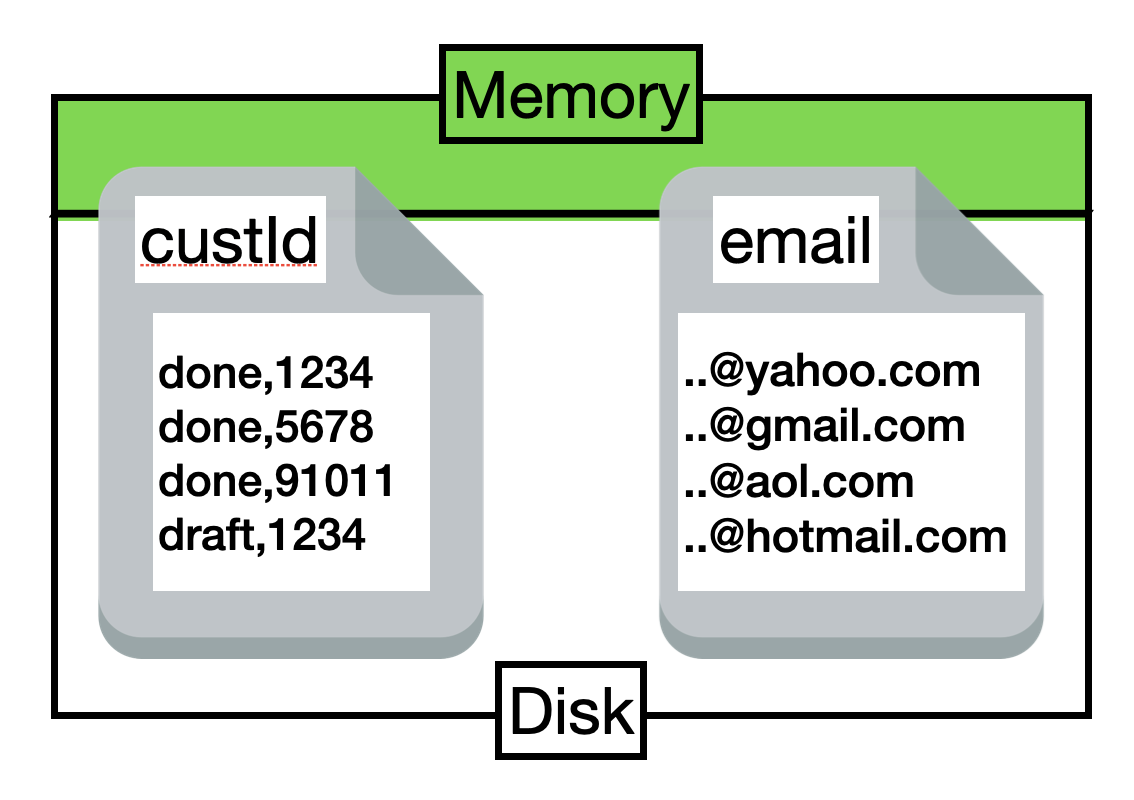
While primary indexes in Couchbase provide a basic way to scan all documents in a bucket by their keys, they come with significant drawbacks that make them unsuitable for most production scenarios. Primary indexes lead to very slow performance because they fetch all documents across all types in the bucket before applying filters, resulting in unnecessary I/O, memory, and CPU waste.

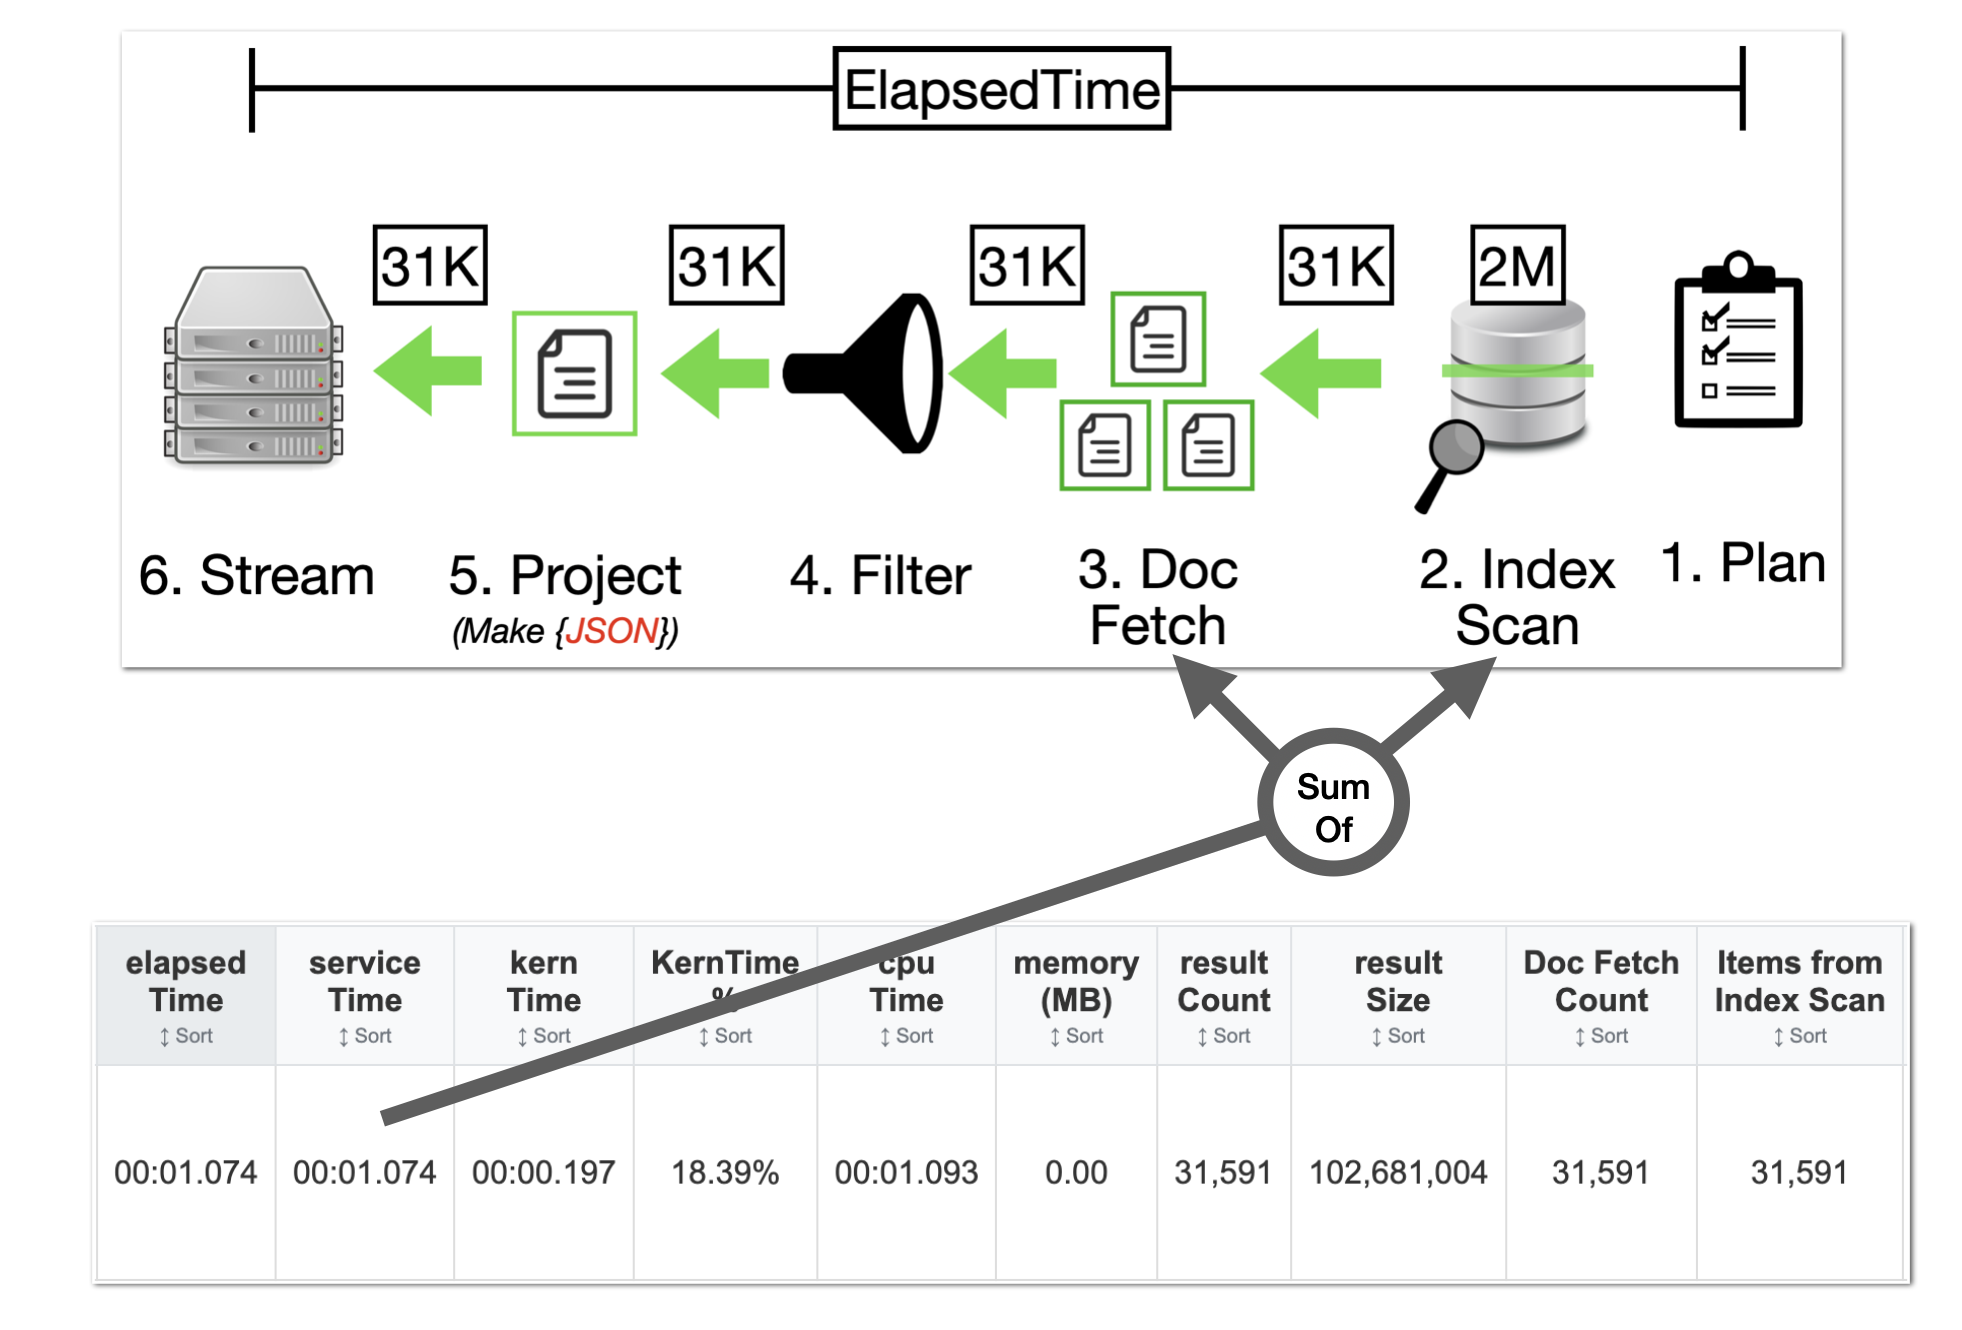
  • Performance Impact: Excessive document retrievals and post-scan filtering make operations "VERY EXPENSIVE"
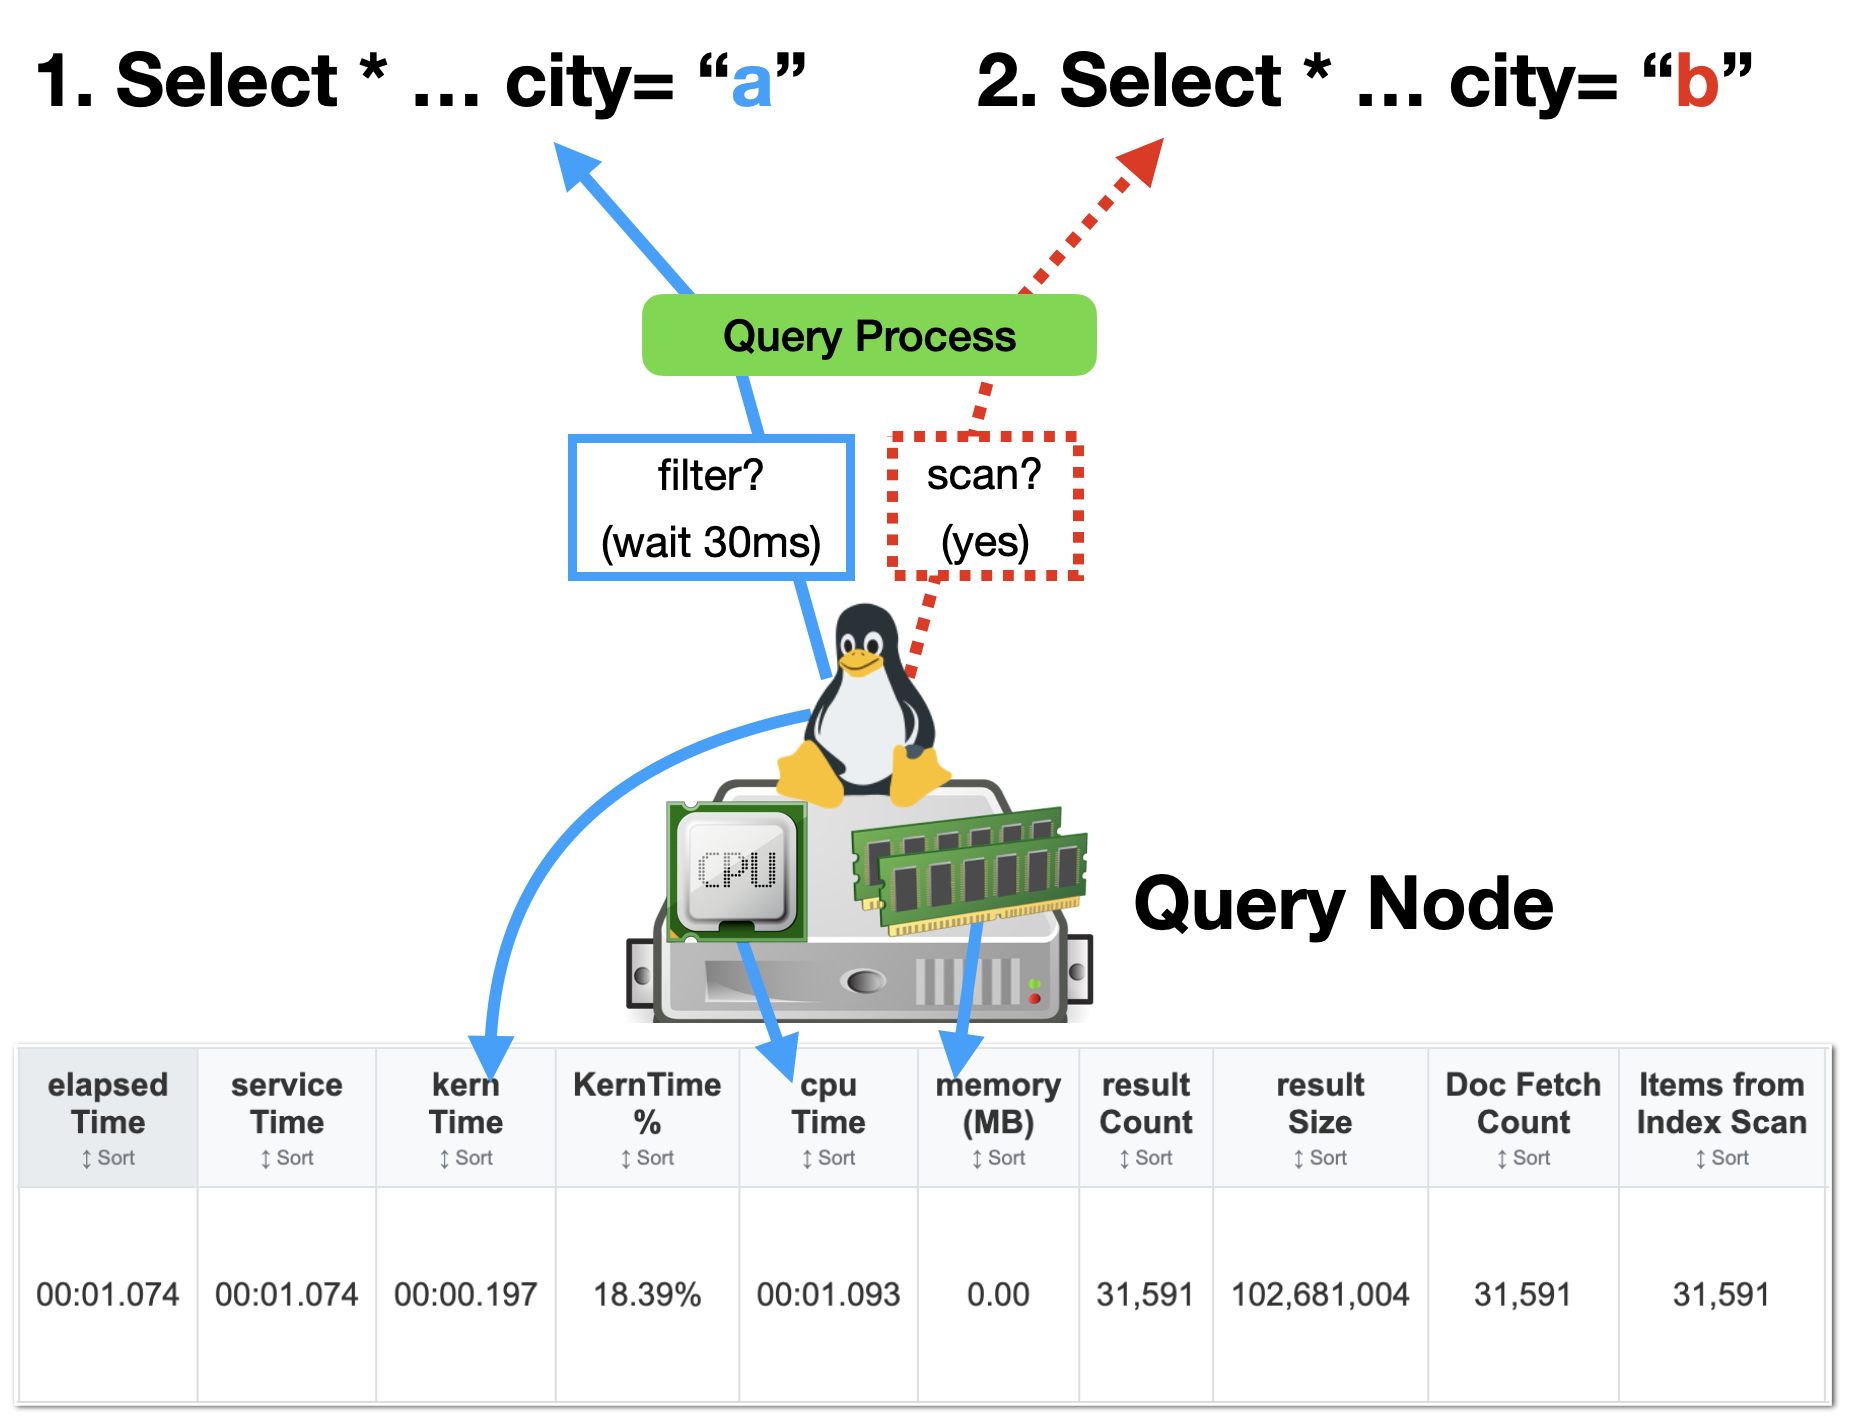
  • Resource Waste: Unnecessary I/O, memory, and CPU consumption
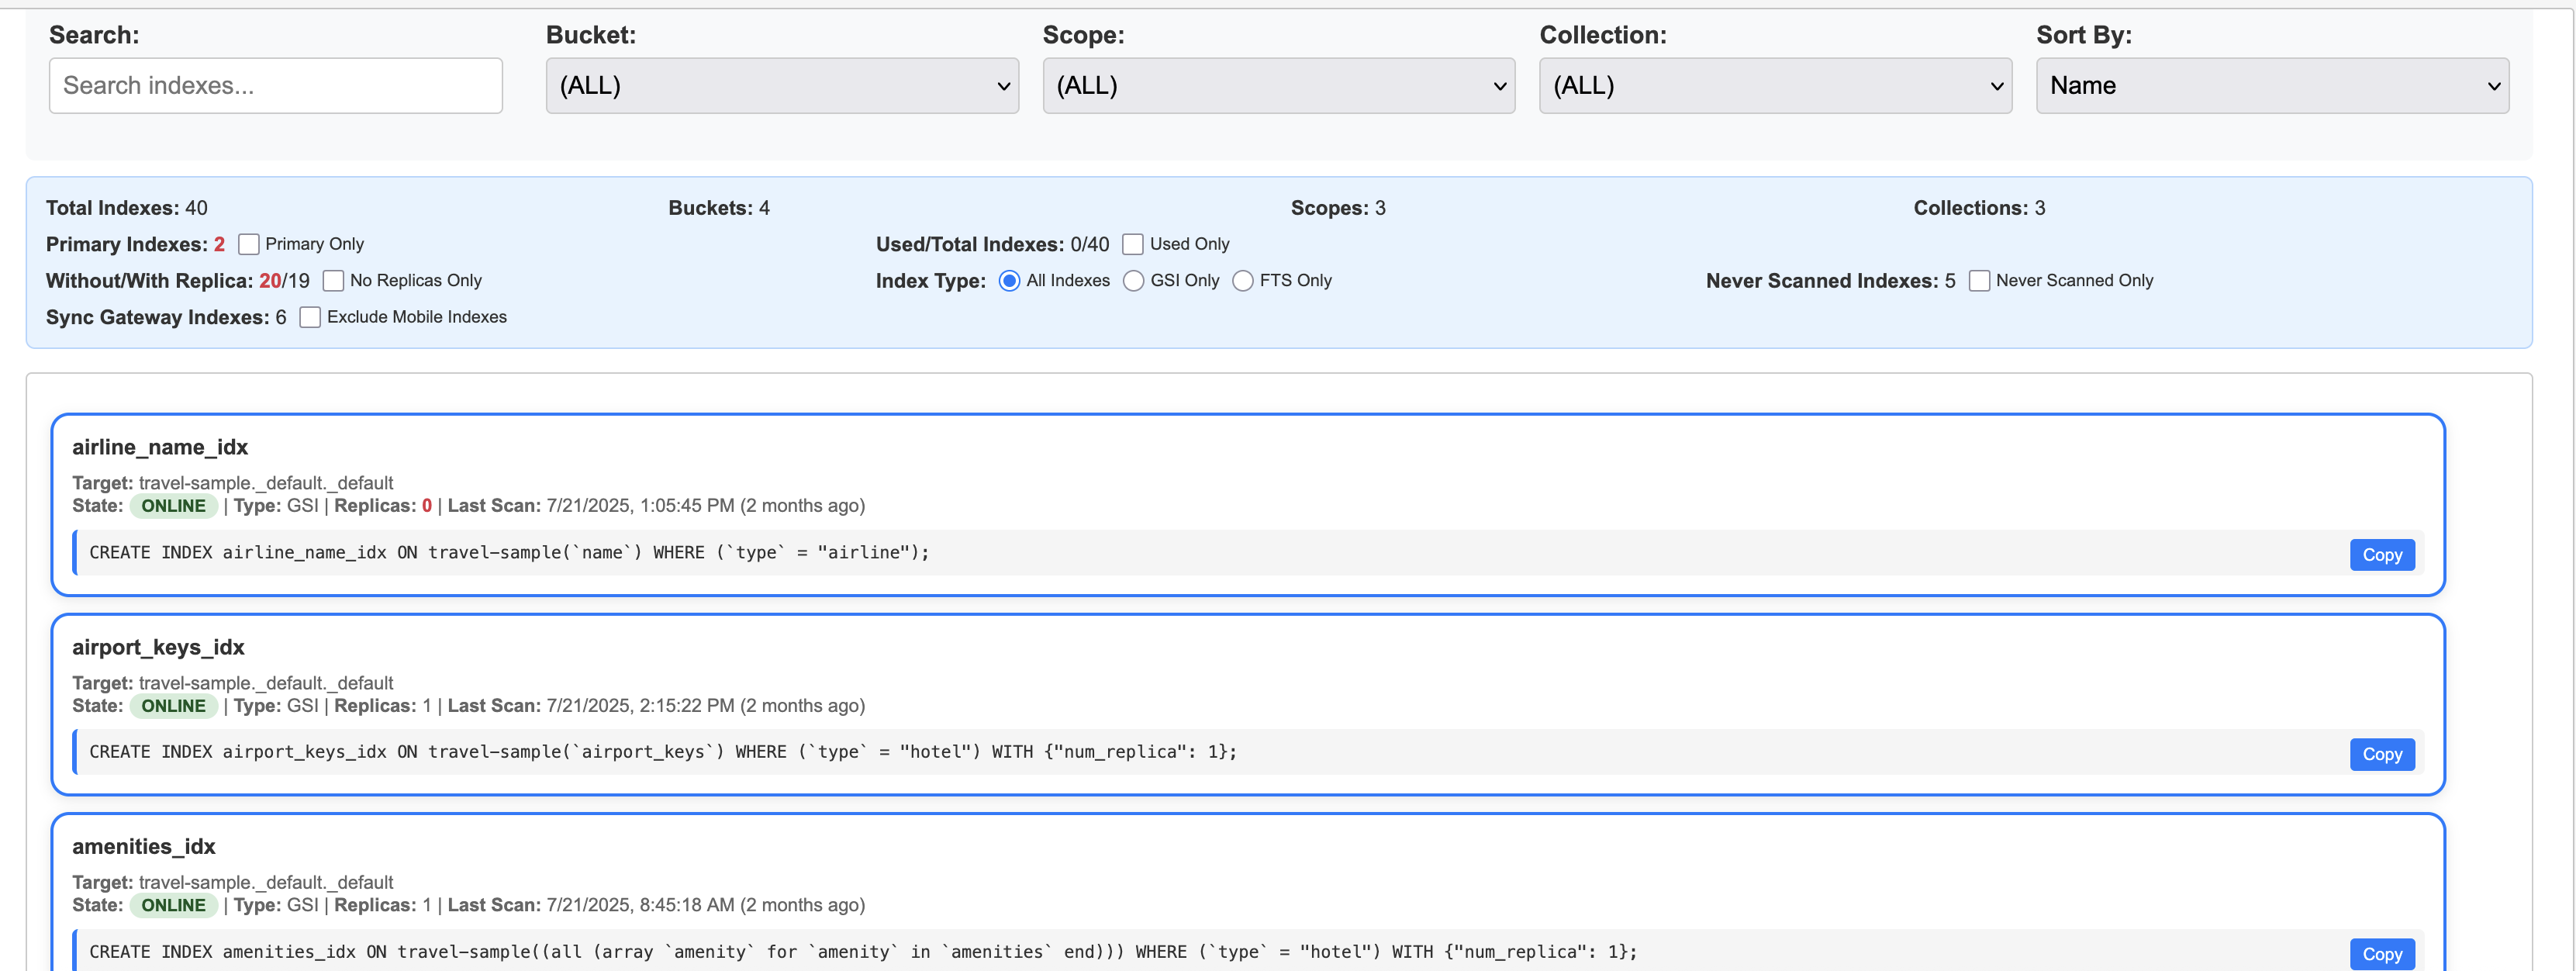
  • Not Recommended: The Couchbase index advisor never recommends primary indexes
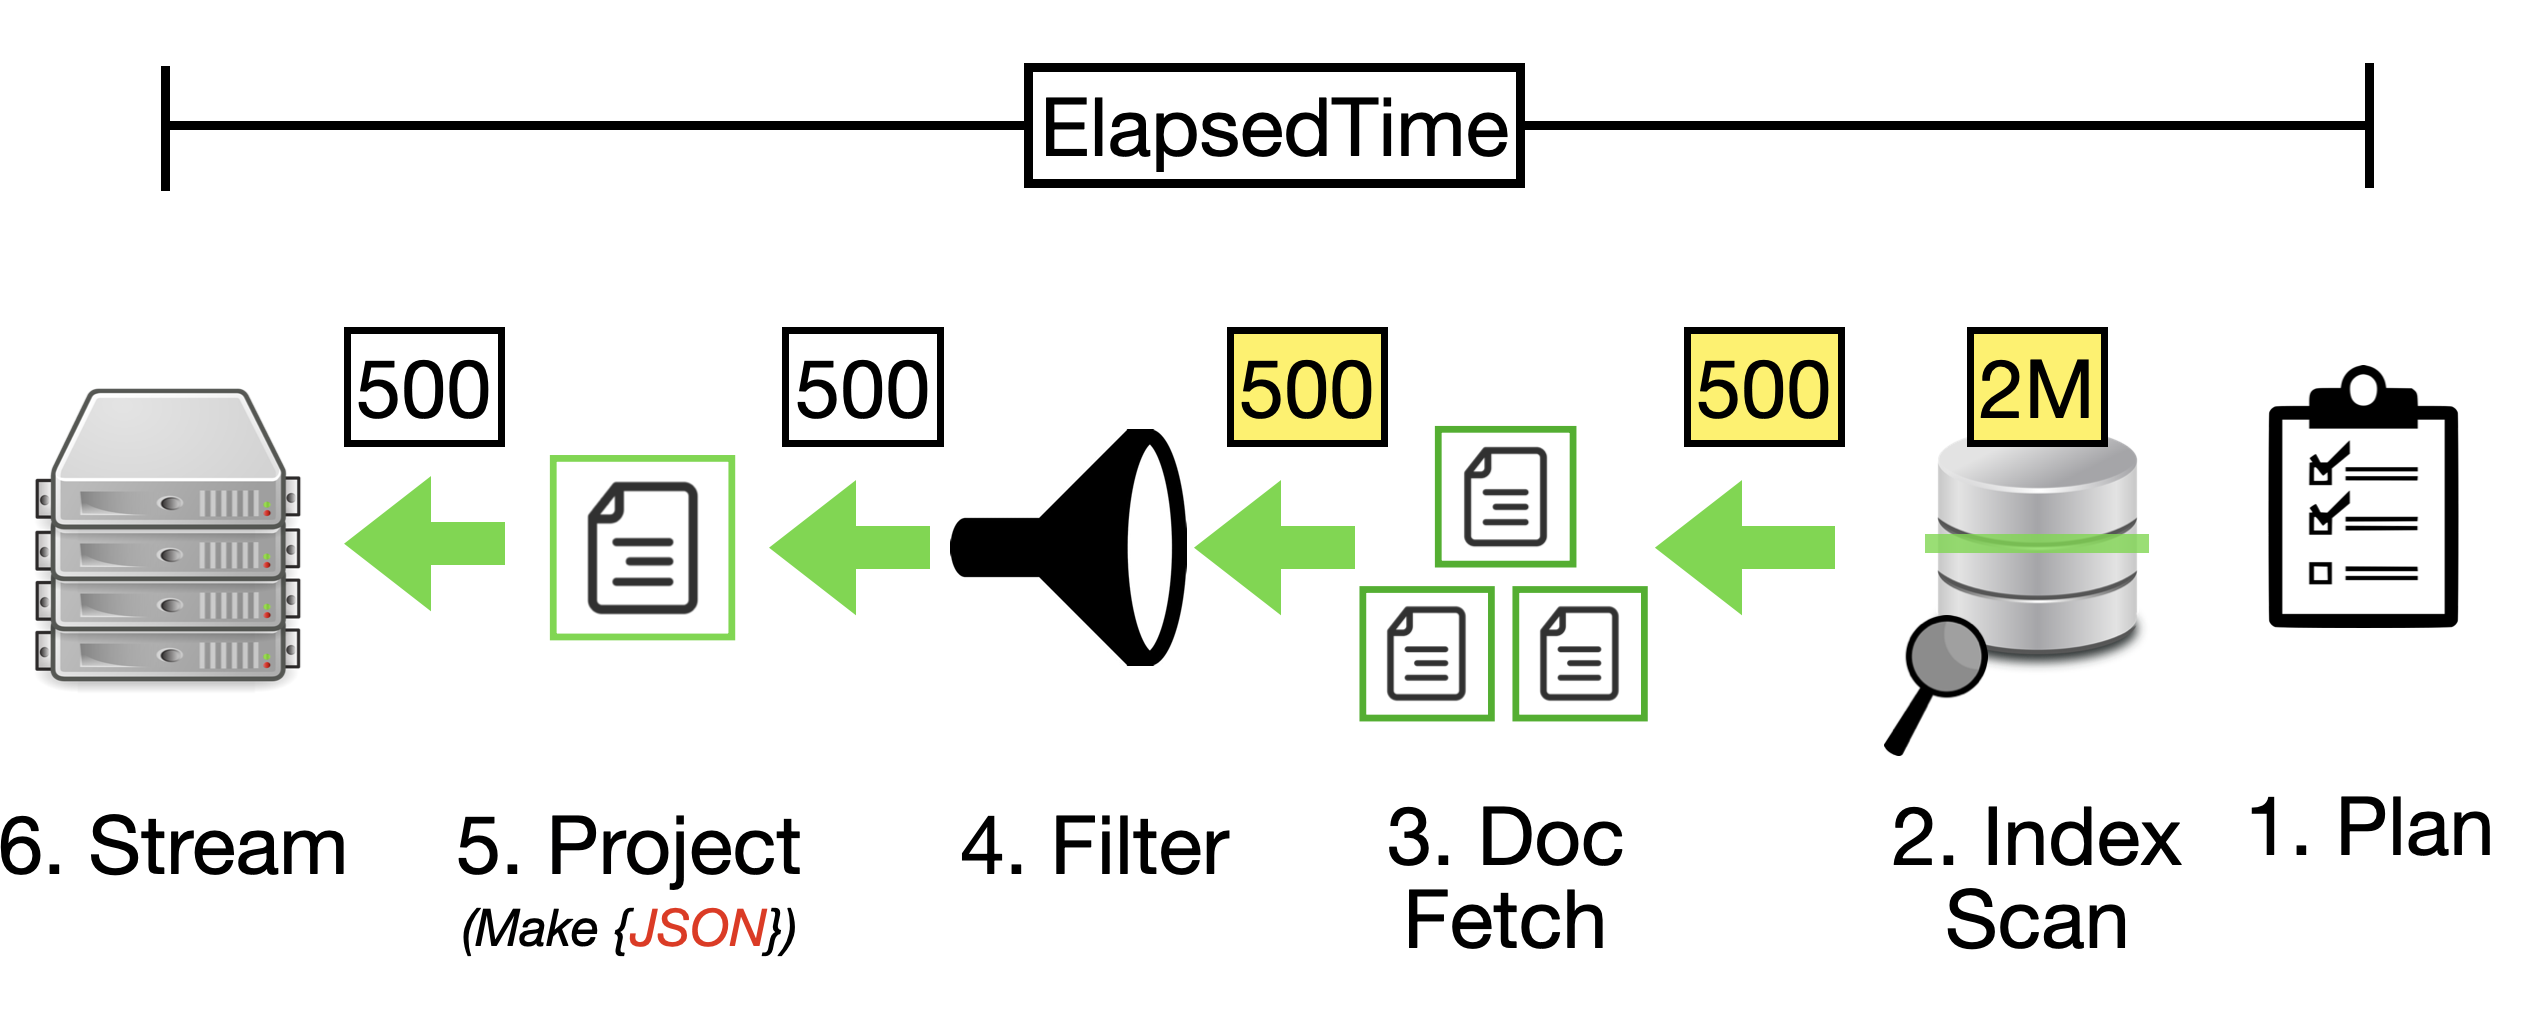
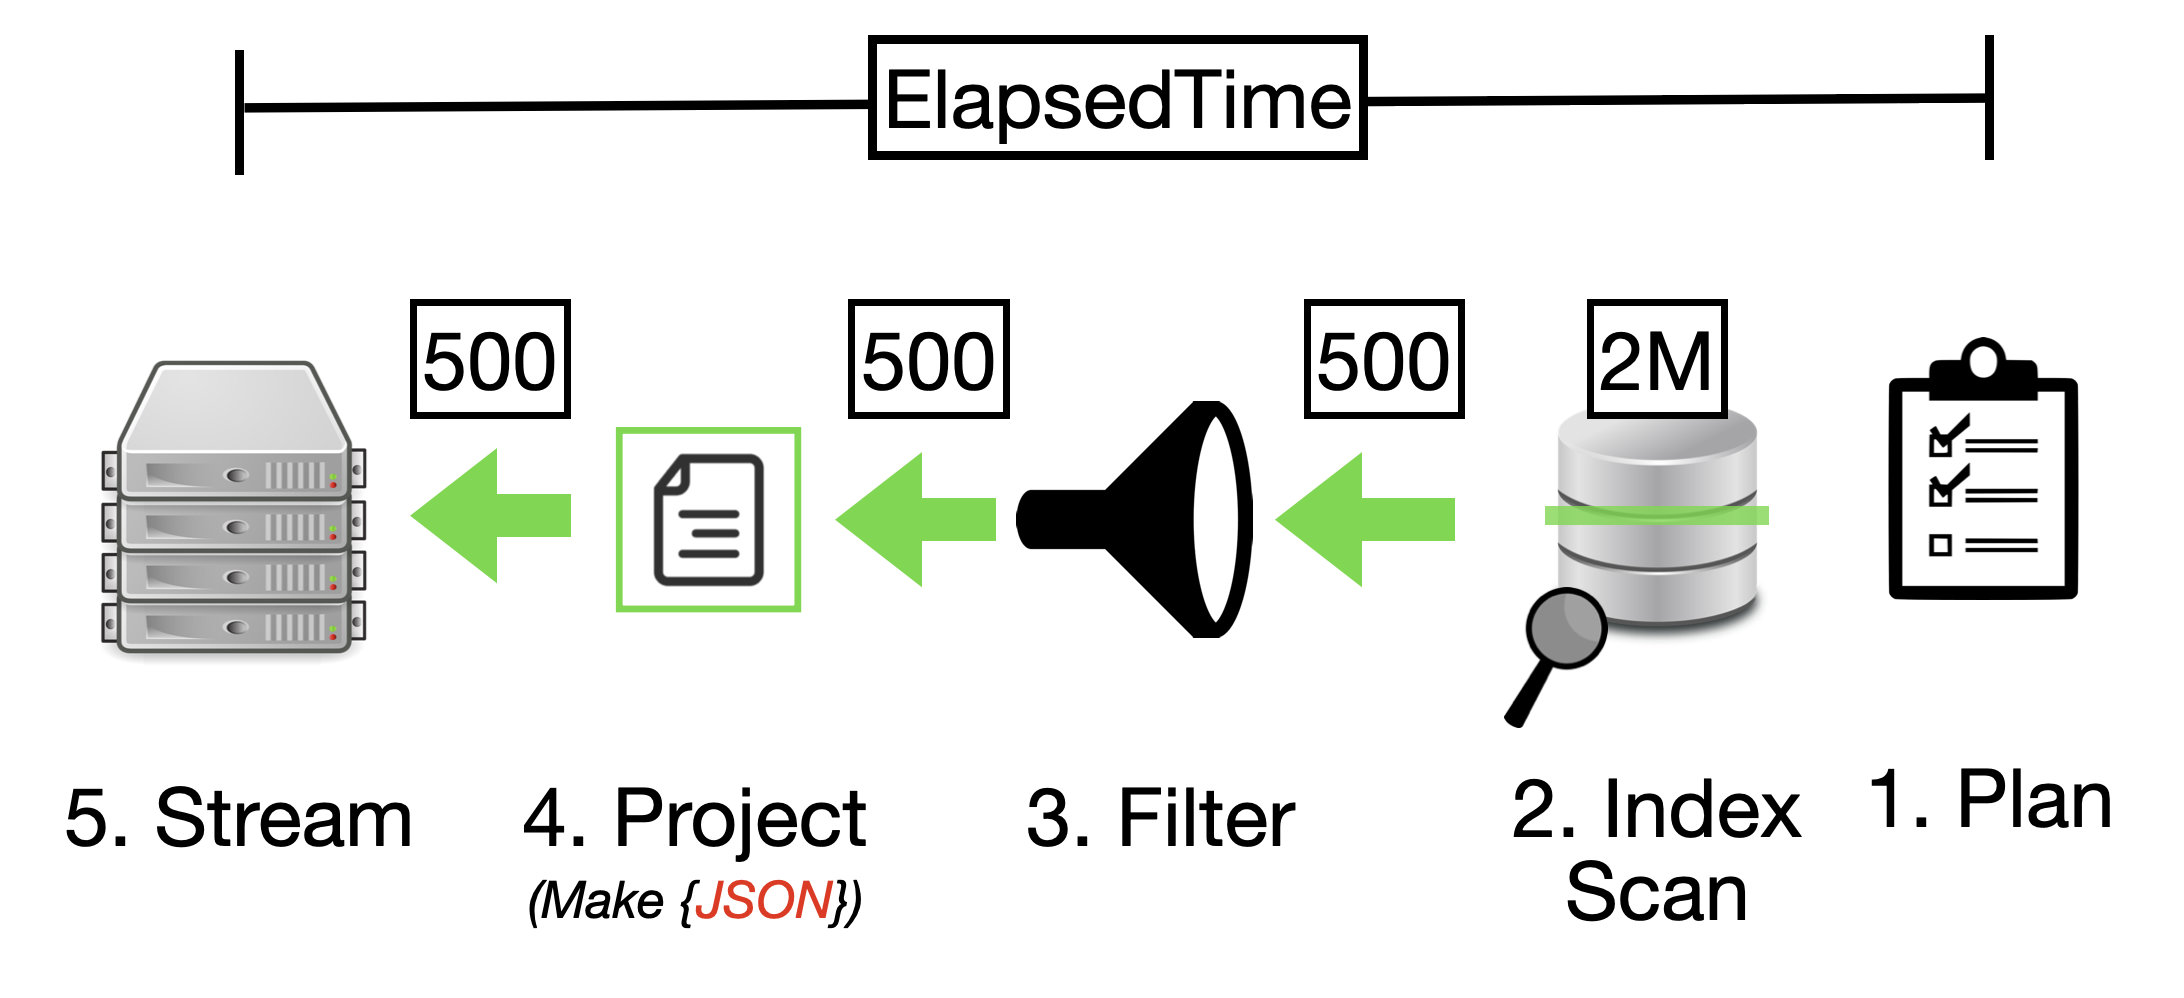
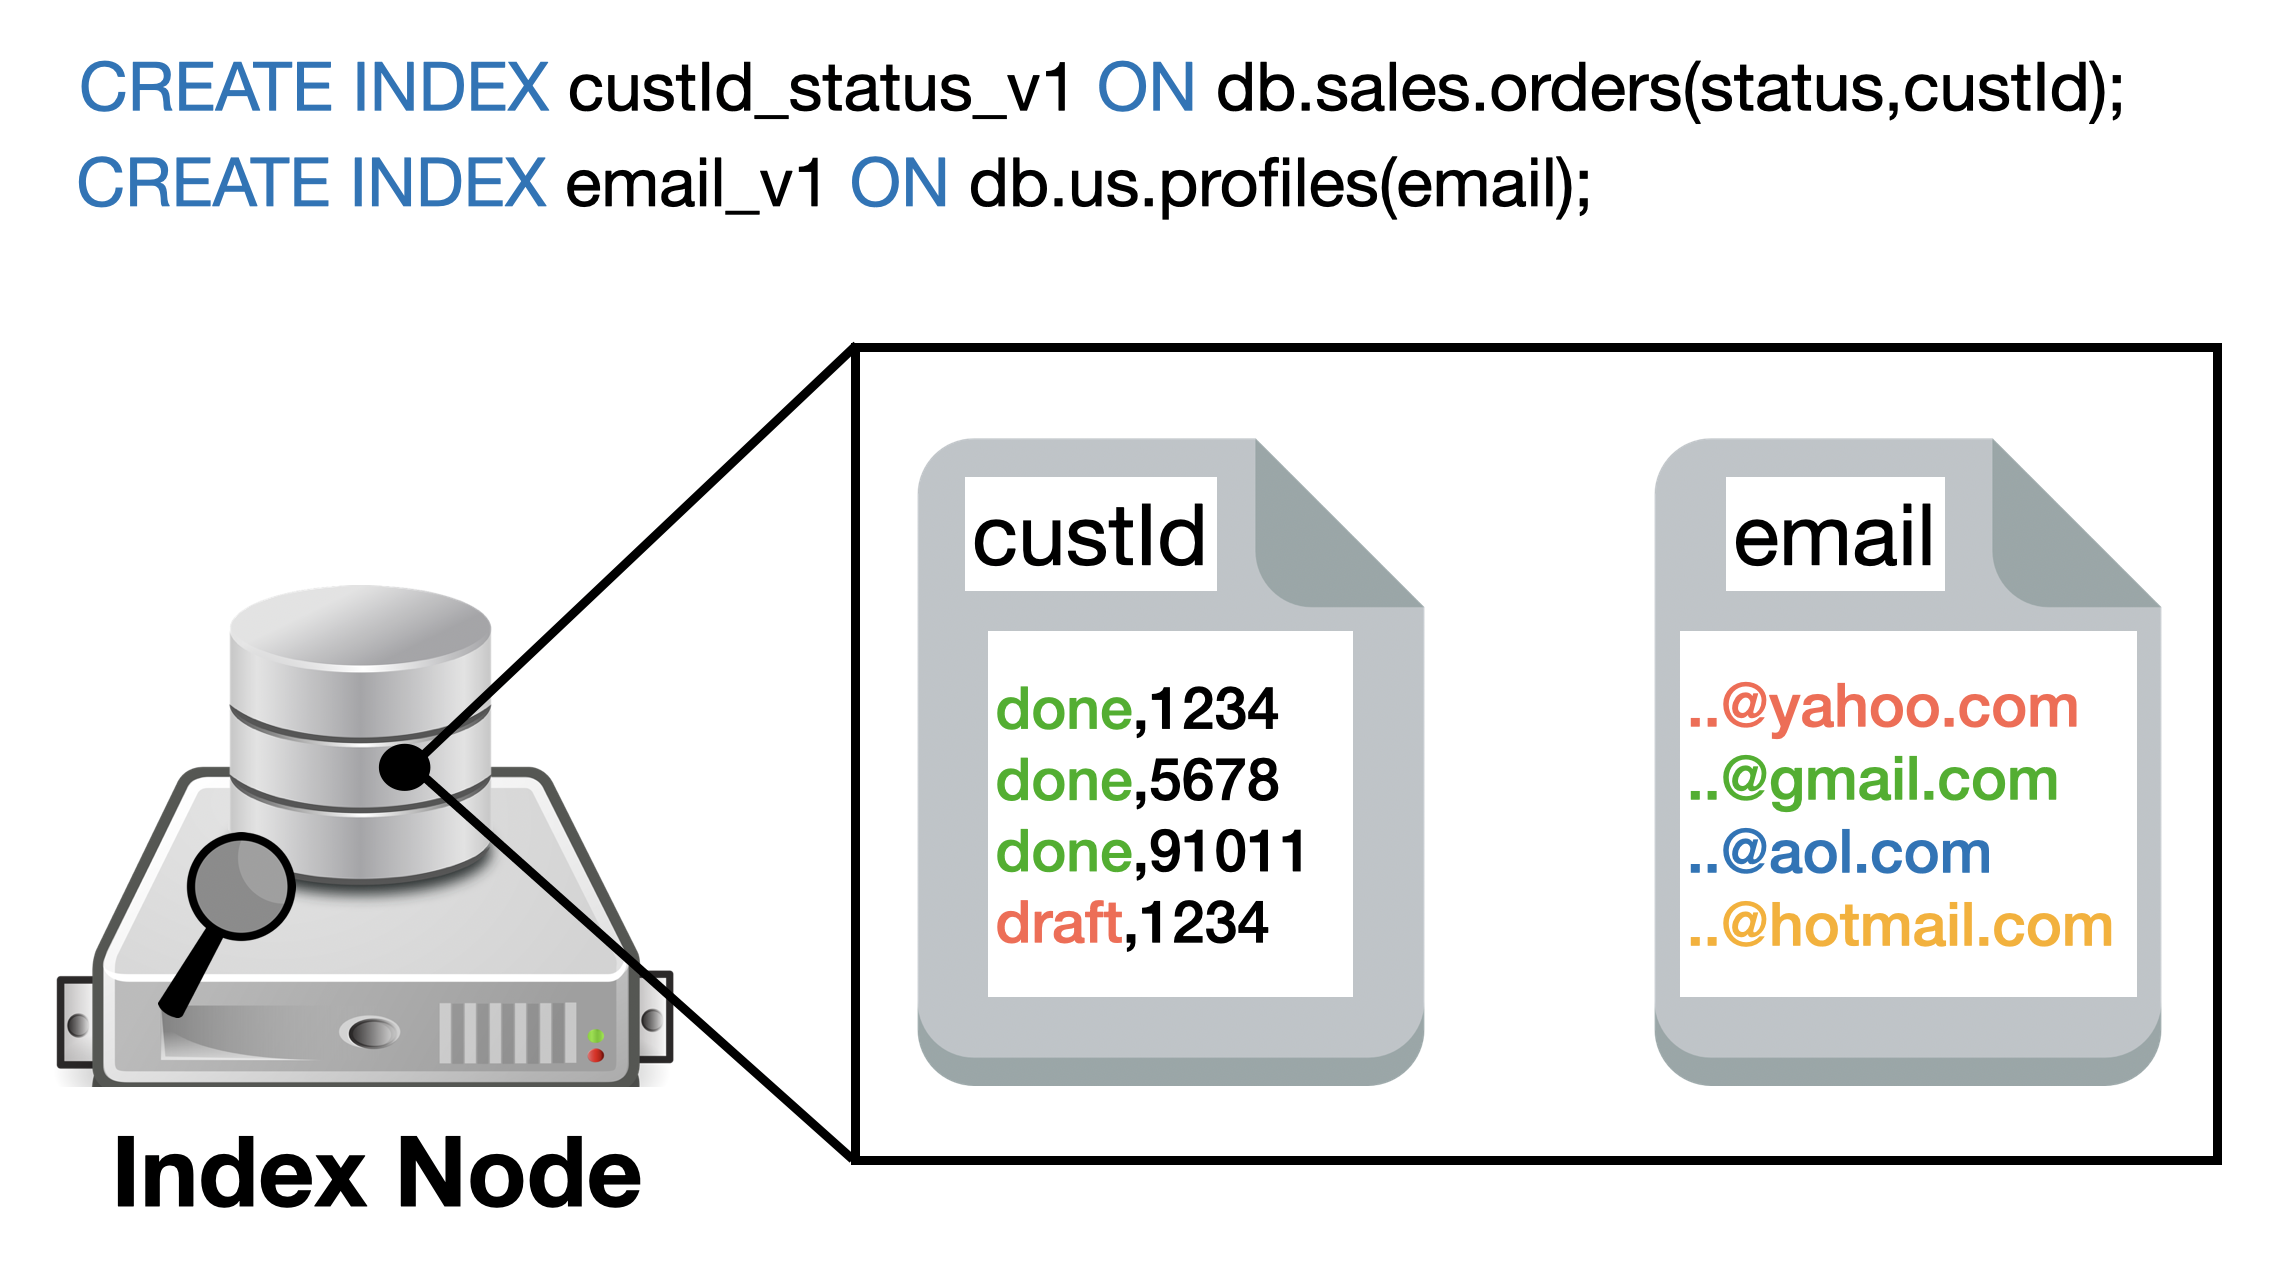
  • Better Alternatives: Secondary or composite indexes are almost always more efficient

Recommendation: Avoid primary indexes in production—use them only for initial data exploration or when no other index applies, and opt for targeted secondary indexes to minimize latency and resource usage.

⚠️ Drawbacks of Sequential Scans WARNING #

Sequential scans in Couchbase involve scanning documents directly without an index, which can be simple but comes with performance limitations. "Sequential scans are intended for simple, ready access to data, and are not intended as a high performance solution."

  • Limited Use Cases: Best suited to small collections where key order is unimportant
  • Index Overhead: Only when the overhead of maintaining an index can't be justified
  • Performance Issues: Lead to full bucket traversals, high latency, and increased resource consumption
  • Primary Index Alternative: For ordered document key operations, a primary index provides the same functionality and will outperform a sequential scan

Recommendation: Avoid sequential scans for large datasets or frequent queries—always prioritize indexing for scalability.

Glossary of Terms

scanConsistency

Controls freshness vs performance of index scans.

  • not_bounded (unbounded) — fastest; may return slightly stale results.
  • at_plus — waits for indexes to catch up to last known mutation time.
  • request_plus — strongest; indexes sync to this request’s timestamp (slowest).

Guidance: use unbounded for analytics, at_plus for recent writes, request_plus for strict freshness.

serviceTime

Calendar time actively executing the query, including waits on Index/Data/FTS services.

  • High vs elapsedTime → execution is the bottleneck.
  • Dominated by servTime in profiling → external services are slow.

See timing relationships

elapsedTime

Total end-to-end time: queuing + execution + result transmission.

  • elapsedTime ≫ execution/service → queuing or large result transfer.
  • Large resultSize or slow network stretches elapsedTime.

See timing diagram

executionTime

Pure query processing time in the Query service (parse → plan → execute), excluding waits on services and result transmission.

  • High values indicate computational complexity or inefficient plans.
  • Optimize via EXPLAIN, better indexes (covering), and simplified logic.
  • Context: see Performance Data for metric relationships.
cpuTime

Cumulative CPU across threads; may exceed wall time due to parallelism.

  • cpuTime ~ serviceTime → CPU‑bound workload.
  • Check sorts, aggregations, and complex expressions.
kernTime

Time the OS kernel spends scheduling the query’s threads (waiting for a CPU), not doing useful work.

  • High kernTime → CPU contention/overload; threads compete for cores.
  • Check node CPU metrics, thread counts, and co-located services; reduce concurrency or add cores.
  • Per operator: time ≈ execTime + servTime + kernTime; high kernTime stretches execution/elapsed time.

See also: Performance Data and System & Node Impact.

state

Execution status of a request.

  • completed — finished successfully
  • running — currently executing
  • cancelled — terminated before completion
  • timeout — exceeded configured timeout
  • error — failed; inspect errors
usedMemory

Peak document memory used (requires memory_quota).

  • High values indicate big payloads, large sorts/aggregations, or inefficient scans.
  • Correlate with resultSize and phase patterns; consider LIMIT/covering indexes.